Scale Factors Scale Diagrams and Maps for University Admission
Updated August 2025
Mastering scale factors and diagrams is a fundamental requirement for the TMUA and ESAT examinations. This guide explains how to apply linear scale factors to similar shapes, interpret complex scale drawings, and perform precise map calculations. Learning these proportional reasoning skills ensures you can accurately relate representations to real world dimensions across various mathematical contexts.
Mathematical similarity occurs when all lengths of one shape are multiplied by a constant scale factor to produce another shape. This relationship is expressed as for maps and diagrams, where one unit on the diagram represents units of the actual object in the same units of measurement.
Similar Shapes and Scale Factors
When two geometric shapes are mathematically similar, the lengths of the sides of one can be calculated from the corresponding sides of the other by using a constant multiplier. This multiplier is known as the scale factor. In similarity, while lengths change, the internal angles of the shapes remain identical.
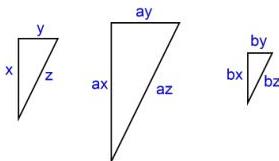
In the diagram above, the three triangles are similar. The first triangle has side lengths , , and . The constants and represent the scale factors used to generate the other triangles. Note that a scale factor can be a fraction less than 1: if , the shape is enlarged: if , the shape is reduced.
Worked Example: Enlarging Trapeziums
Trapezium B is a mathematical enlargement of Trapezium A with a scale factor of 3. We are required to find the values of the missing sides , , , and .
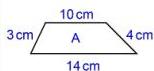
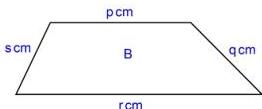
Because the scale factor is 3, every single length on Trapezium A must be multiplied by 3 to determine the corresponding length on Trapezium B:
- For side : .
- For side : .
- For side : .
- For side : .
Scale Diagrams
A scale diagram is a mathematically similar representation of an original object or drawing, usually rendered at a smaller size. By comparing a known length on both diagrams, the scale factor can be deduced and used to find other unknown dimensions.
Worked Example: Using Similarity in Scale Drawings
In the following figures, Figure B is a scale drawing of Figure A. We need to calculate the values of and .
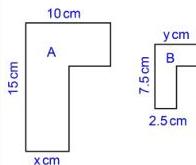
First, we identify corresponding sides with known lengths to find the scale factor. We see that the length in Figure A corresponds to in Figure B. Since is half of , the scale factor from Figure B to Figure A is . Conversely, the scale factor from Figure A to Figure B is 2.
- To find (a length in Figure A): .
- To find (a length in Figure B): Since the corresponding length in Figure A is , we know that . Solving this gives .
Maps
Maps are specific types of scale diagrams. The scale is typically given as a ratio . For instance, a scale of means that 1 unit on the map represents of the same units in real life. Because , this could also be described as 1 cm representing 1 km.
Worked Example: Map Calculations
A map has a scale of .
Scenario 1: The map distance from the bank to the post office is . How far is this in reality, in metres?
First, calculate the distance in centimetres: . Next, convert to metres by dividing by 100: .
Scenario 2: The real distance from the supermarket to the bank is . How many millimetres is this on the map?
First, convert the real distance to centimetres: . Next, divide by the scale factor to find the map distance in cm: . Finally, convert to millimetres: .
Key takeaways
- Mathematical similarity implies that all corresponding lengths are related by the same constant scale factor.
- A scale factor represents an enlargement, while represents a reduction.
- Map ratios like apply only when both the map distance and the real distance are in the same units.
- When converting map distances to real world distances, always perform the multiplication by the ratio first, then convert the units (e.g., cm to km).
When working with maps, always convert your final answer to the unit requested in the question (e.g., km or m). It is usually safest to do all map-ratio arithmetic in centimetres first to avoid decimal errors, then convert to larger units at the end.
Ensure you are using the correct 'direction' for the scale factor. If moving from a small diagram to a large object, multiply by the scale factor: if moving from a large object to a small diagram, divide by it.
The linear scale factor only applies to lengths. If a question involves area or volume, you must remember that area scales by and volume scales by , where is the linear scale factor.
Worked Examples
Frequently asked questions
What does a map scale of 1 to 50,000 actually mean?
It means that any distance measured on the map is times larger in reality. For example, on the map represents (or ) in the real world.
If a shape is reduced in size, is the scale factor negative?
No: a reduction in size uses a positive scale factor between 0 and 1. A negative scale factor refers to an enlargement that is also inverted through a centre of enlargement.
Do angles change when a shape is scaled by a factor of 3?
No: in mathematically similar shapes, all corresponding angles remain identical regardless of the scale factor applied to the lengths.
How do I find the scale factor if I have the lengths of two corresponding sides?
You divide the length of the side on the image by the length of the corresponding side on the original object: .