Gradients and Areas Under Graphs for the TMUA
Updated August 2025
This section covers the calculation and estimation of gradients and areas for both linear and non-linear graphs. Mastery of these techniques is essential for interpreting physical and financial models on the TMUA, where gradients represent rates of change like speed, and areas represent accumulated quantities like distance.
The gradient of a graph measures the rate of change of the vertical variable () with respect to the horizontal variable (), calculated as . The area under a graph represents the product of these two variables, effectively summing their values over a specified interval.
Gradients of Straight Line Graphs
The gradient of a straight line, typically written in the form , is the constant . If you are given two specific points on a straight line, and , the gradient of that line is calculated as the change in the coordinates divided by the change in the coordinates:
Worked Example: Gradient of a Line Segment
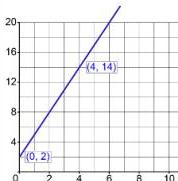
To find the gradient of the line segment shown in the diagram below, follow these steps:
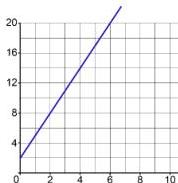
- Select two points on the line that have clear integer coordinates. In this instance, we can identify the points and .
- Apply the gradient formula: . The gradient of this line is 3.
Gradients of Curves
Unlike a straight line, the gradient of a curve changes at every point. The gradient of a curve at a specific point is defined as the gradient of the tangent to the curve at that point. A tangent is a straight line that just touches the curve at a point and possesses the same slope as the curve at that exact location.
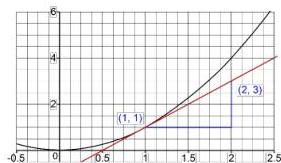
In the graph above showing , a tangent is drawn at . Since the tangent also passes through , its gradient is . Thus, the gradient of the curve at is 2.
Worked Example: Finding the Gradient at a Point
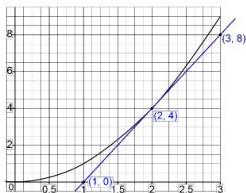
Find the gradient of the curve at the point .
- Plot the curve using a large scale. Calculate several coordinates around to ensure accuracy: .
- Carefully draw a tangent at . A good method is to place a ruler so that an equal amount of the curve is visible on either side of the point, then slide it in until it touches the point.
- Pick two points on your tangent. In the diagram below, the points and are selected.
- Calculate the gradient of the tangent: . The gradient of the curve at is 4.
Area Under a Straight Line Graph
The phrase area under a graph refers to the region between the line and the horizontal axis (-axis). For straight-line graphs, this area is usually composed of basic geometric shapes like triangles, rectangles, and trapezia.
Worked Example: Calculating Exact Area
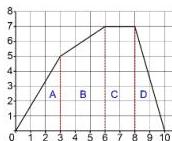
To find the area under the piecewise linear graph shown below, split the total region into manageable sections.
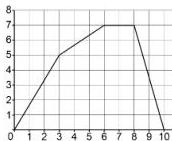
- Section A is a triangle: .
- Section B is a trapezium: .
- Section C is a rectangle: .
- Section D is a triangle: .
- Sum the individual areas: units squared.
Approximate Areas Under Curves
When dealing with non-linear graphs like quadratics, the area is estimated by dividing the region into vertical strips. These strips are usually triangles or trapezia, which provide a close fit to the curve. The accuracy improves as the width of these strips decreases.
Worked Example: Estimating Area Under a Curve
Find the approximate area under the curve for .
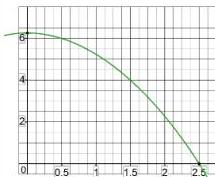
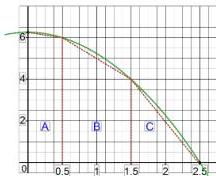
- Divide the area into three strips using vertical boundaries: two trapezia (A and B) and one triangle (C).
- Calculate the area of Trapezium A: .
- Calculate the area of Trapezium B: .
- Calculate the area of Triangle C: .
- The total estimated area is , which rounds to to one decimal place.
Interpretation of Results
In real-world contexts, the gradient and area have physical meanings based on the units of the axes:
- Gradient interpretation: If distance is on the vertical axis and time is on the horizontal axis, the gradient represents speed: .
- Area interpretation: If speed is on the vertical axis and time is on the horizontal axis, the area represents distance: .
Worked Example: Speed Time Graph
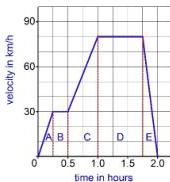
Consider the car journey represented by the speed-time graph below. The distance is the area under the graph.
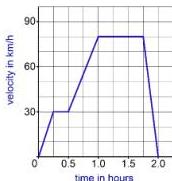
- Triangle A: km.
- Rectangle B: km.
- Trapezium C: km.
- Rectangle D: km.
- Triangle E: km.
Total distance = km.
Key takeaways
- The gradient of a curve at a point is found by drawing a tangent and calculating its gradient.
- The area under a graph is calculated exactly for linear segments and estimated using trapezia for curves.
- In distance-time graphs, the gradient is the speed; in speed-time graphs, the gradient is acceleration and the area is distance.
- Always use consistent units when calculating and interpreting gradients or areas.
When asked to interpret a graph, check the units on both axes first. The units of the gradient will be (vertical unit) / (horizontal unit), and the units of the area will be (vertical unit) (horizontal unit).
Be careful with the term area under a graph when the graph goes below the -axis. In the context of kinematics, area represents distance, which is scalar. If the graph goes below the axis (negative velocity), the area still contributes to total distance but may represent a negative displacement.
This topic is the foundation of Calculus. The process of finding the gradient at a point is the geometric equivalent of differentiation, while finding the area under a graph corresponds to integration.
Worked Examples
The graph shows how the resultant horizontal force acting on the ball varies with time during this collision.
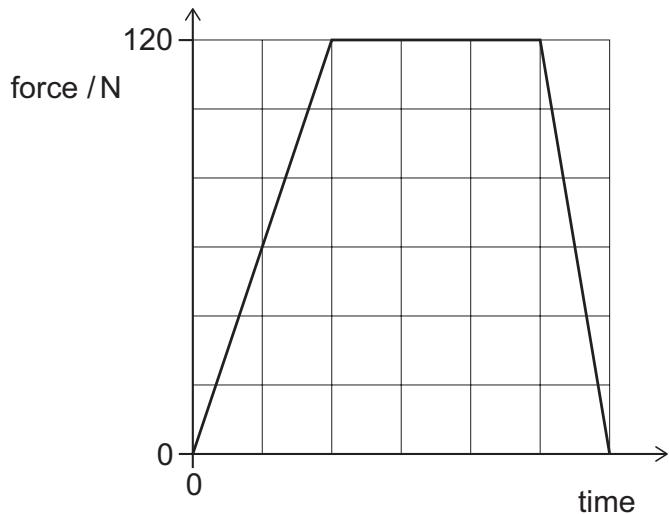
What is the duration of the collision?
Practice Questions
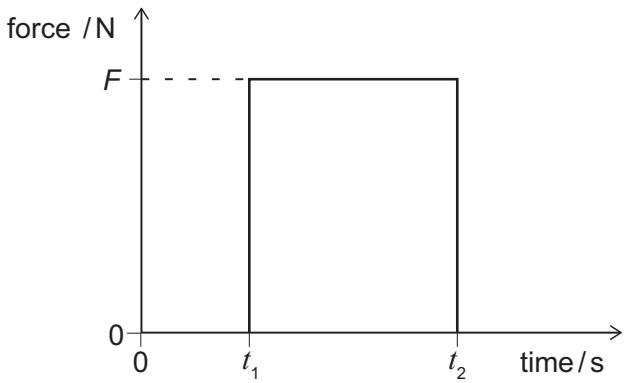
Which expression gives the magnitude of the momentum of the ball as it leaves the racket?
Frequently asked questions
What does the area under a graph represent in a financial context?
In financial contexts, if the vertical axis represents a rate (e.g. income per month) and the horizontal axis represents time, the area under the graph represents the total accumulated amount (e.g. total income over that period).
How do I ensure my estimate for a curve's gradient is as accurate as possible?
To improve accuracy, use a very large scale when plotting the graph and select two points on your tangent that are far apart. This reduces the relative error in your measurement.
Is the trapezium rule always an overestimate or an underestimate?
It depends on the curvature. If the curve is concave upwards (like ), the trapezium rule usually overestimates the area because the straight-line top of the trapezium lies above the curve. If the curve is concave downwards, it tends to be an underestimate.