Interpreting Graphs and Kinematics in Context
Updated August 2025
Learn how to interpret mathematical graphs in real-world situations, including linear, reciprocal, and exponential models. This lesson covers finding approximate solutions to practical problems, such as kinematic scenarios involving distance, speed, and acceleration. Master the skills needed to translate visual data into quantitative answers for university admission tests.
Mathematical functions such as , , and can model physical phenomena where the intercept, gradient, or shape of the curve represents real-world variables like fixed costs, inverse relationships, or growth rates.
Graphs in real-world contexts allow us to find approximate solutions to complex problems by visualising the relationship between variables. Understanding the specific characteristics of different graph types is essential for interpreting these contexts accurately.
Straight Line Graphs
Straight line graphs that pass through the origin () represent a simple proportional relationship. For example, the cost of items when there is no bulk discount or the distance travelled at a constant speed. If the line does not pass through the origin (), the intercept often represents an initial or fixed charge, followed by a proportional relationship represented by the gradient .
Example: Poster Printing
The cost of printing a poster consists of an initial set-up fee plus a fixed cost for each poster printed. We can use the graph below to find these values.
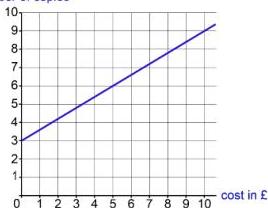
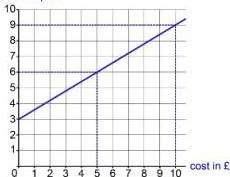
To find the set-up cost, we look at the cost when 0 copies are printed. From the graph, this intercept is . To calculate the unit cost (the cost per poster), we find a point the graph passes through clearly, such as . The cost for these 10 copies, excluding the set-up fee, is . Therefore, the unit cost is per poster. Using this, the cost for 500 posters would be the set-up fee plus the unit cost: .
Reciprocal Graphs
Reciprocal graphs of the form are used to model inverse proportion, where one variable increases as the other decreases such that their product remains constant ().
Example: Gas Pressure and Volume
The graph below shows the pressure in atmospheres, , plotted against the volume, , of a gas in litres.
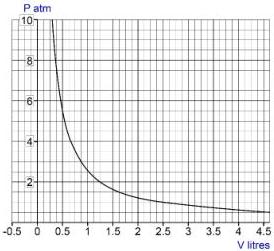
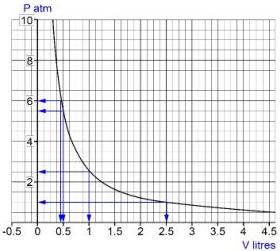
To deduce if is inversely proportional to , we check if , or . From the graph, when , , suggesting . We verify this for other points:
- At , so .
- At , so .
- At , so .
Since is constant, we can conclude .
Exponential Graphs
Exponential curves of the form model growth or decay where a quantity changes by a constant factor over equal time periods. Common examples include population growth or radioactive decay.
Example: Bacteria Growth
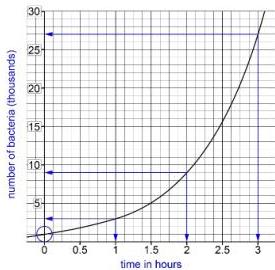
The relationship between the number of bacteria (in thousands) and time (in hours) is .
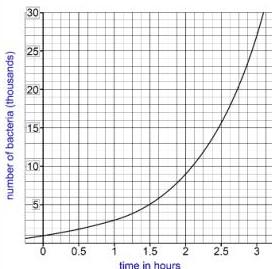
At the start (), , which represents 1000 bacteria. After 1 hour, ; after 2 hours, . We can see the population is multiplied by 3 every hour, so . The equation is . To find the population at the end of 4 hours, we calculate , which is 81,000 bacteria.
Kinematics: Distance Time Graphs
Non-standard graphs often represent kinematic problems. In a distance-time graph, the vertical axis represents distance from a fixed point and the horizontal axis represents time.
- A straight line indicates a constant speed. The gradient of the line is the speed.
- A horizontal line indicates the object is stationary.
- A curve indicates non-constant speed (acceleration or deceleration).
Example: Ania's Journey
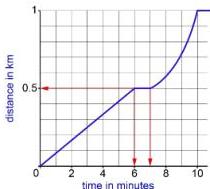
The graph shows Ania's journey from home to school, 1 km away.
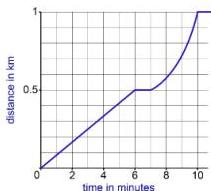
Ania stops at a shop to wait for a friend. The graph is flat between 6 and 7 minutes, so she waits for 1 minute. The shop is 0.5 km (500 m) from home. Her walking speed to the shop is . The journey from the shop to school is curved, meaning she is not moving at a constant speed; the increasing gradient shows she is accelerating. Her average speed for this 500 m leg over 3 minutes is .
Key takeaways
- The y-intercept in a linear context usually represents a fixed starting value or initial cost.
- In a reciprocal graph (), the product of the variables and is constant ().
- On a distance-time graph, the gradient represents speed, and a curve indicates acceleration.
- Exponential growth is characterised by a constant multiplier for each unit of time increase.
Always check the units on both axes before calculating. If the distance is in km and time is in minutes, you may need to convert minutes to hours to give speed in km/h.
Do not assume a relationship is linear just because it looks straight over a small range. Test multiple points for reciprocal () or exponential () properties.
Kinematic graphs are a visual representation of calculus. The gradient of a distance-time graph is the velocity, while the gradient of a velocity-time graph is the acceleration. Conversely, the area under a speed-time graph represents the total distance travelled.
Worked Examples
A radiation detector is placed very near to a sample of the radioactive isotope in a laboratory. The count rate on the detector changes as time elapses. The graph shows how the measured count rate changes with time.
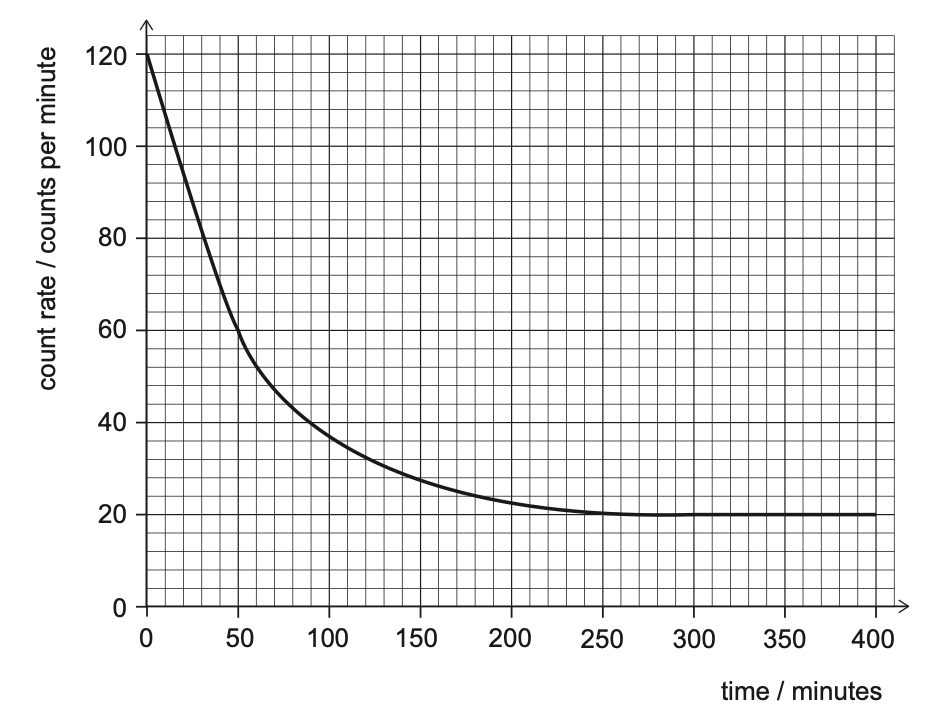
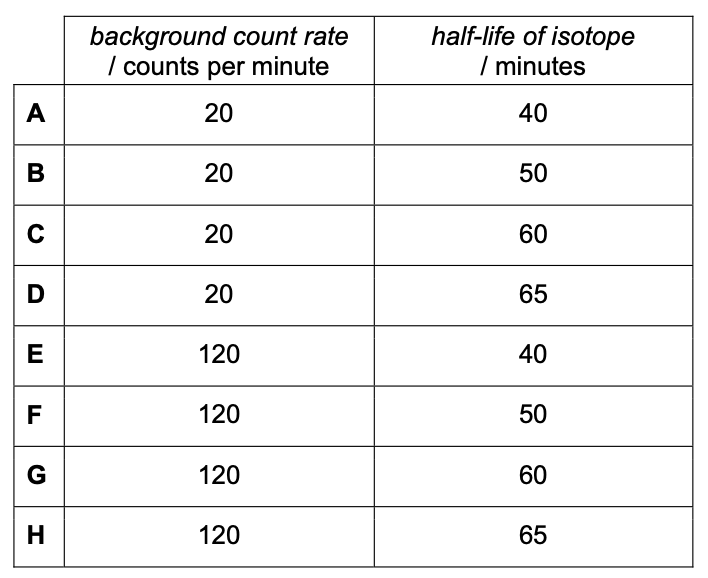
What is the background count rate and what is the half-life of the isotope?
Practice Questions
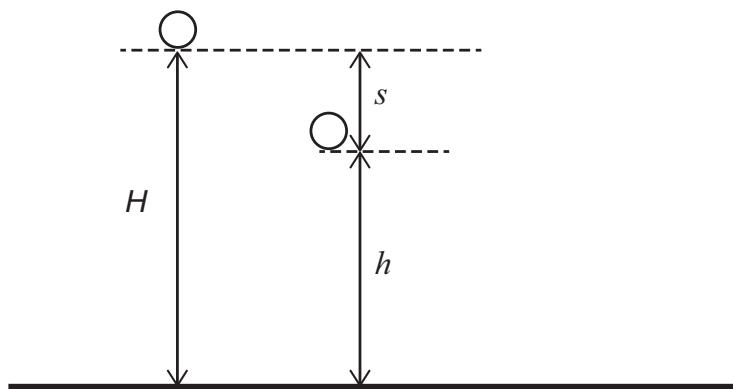
The graph shows two quantities plotted.
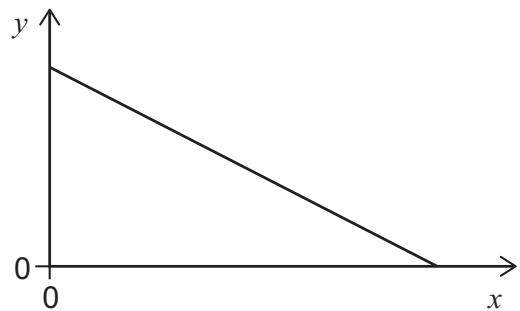
Which of the rows show(s) a possible pair of quantities for the axes?
(Assume that air resistance is negligible.)
| | y-axis | x-axis |
|---|---|---|
| 1 | h | t |
| 2 | kinetic energy | h |
| 3 | gravitational potential energy | s |
Frequently asked questions
How do I determine the constant k in an inverse proportion graph?
Select a clear coordinate from the curve and multiply the values together. Since , the constant is found by .
What is the difference between speed and average speed on a graph?
Speed at a specific moment is the gradient of the graph at that point. Average speed is the total distance travelled divided by the total time taken for a specific interval.
How do I calculate a multiplier for an exponential graph?
Look at the values of for consecutive integer steps of . For instance, if goes from 1 to 2 and goes from 4 to 12, the multiplier is .