Recognising and Interpreting Algebraic and Trigonometric Graphs
Updated August 2025
This lesson teaches the fundamental shapes and properties of linear, quadratic, cubic, reciprocal, exponential, and trigonometric graphs for the TMUA. Understanding these curves allows for rapid visual problem solving, identifying roots, and finding intersections. Mastery of these standard forms is essential for interpreting functions in diverse mathematical contexts.
A graph is a visual representation of a function, where specific algebraic forms correspond to predictable geometric shapes such as lines, parabolas, and periodic waves.
Linear Functions
The graph of a linear function is a straight line. It is most commonly expressed in the form . In this equation, represents the gradient (steepness) of the line, and represents the y-intercept, which is the point where the line crosses the y-axis.
Quadratic Functions
The graph of a quadratic function forms a characteristic curve known as a parabola. Its orientation is determined by the coefficient . If , the curve is shaped (opening upwards), and if , the curve is shaped (opening downwards).
Every quadratic graph has a single turning point and a vertical line of symmetry that passes through this point. The y-intercept is always at the value . The x-intercepts, or roots, are the solutions to the equation .
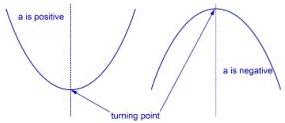
The turning point can be found by completing the square to find the minimum or maximum value of the function.
Simple Cubic Functions
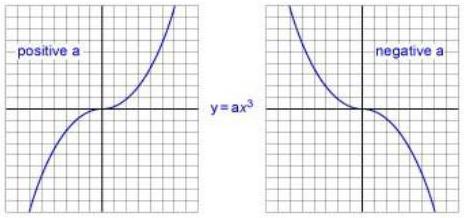
A basic cubic function of the form has a distinct shape that passes through the origin. These graphs possess rotational symmetry of order 2 about the origin, meaning the graph looks the same if rotated 180 degrees around .
The Reciprocal Function
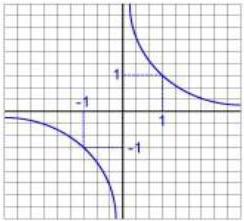
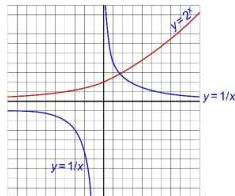
The reciprocal function is defined as where . Because the denominator cannot be zero, the graph never touches the y-axis. Similarly, can never be zero, so it never touches the x-axis.
If is positive, is also positive. If is negative, is negative. Consequently, the curve exists only in the first and third quadrants. The graph passes through the coordinates and . As increases, decreases towards zero, and as approaches zero, increases towards infinity.
The Exponential Function
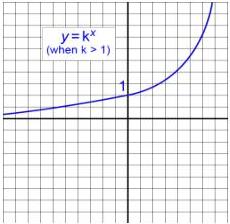
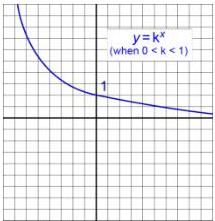
The exponential function is given by for positive values of . Because any number to the power of zero is one (), all exponential graphs pass through the point .
When , the function represents exponential growth. As increases, increases rapidly. For negative values of , the value of stays between 0 and 1, getting closer to zero as becomes more negative.
When , the function represents exponential decay. As increases, decreases rapidly towards zero. For negative values of , the value of increases as becomes more negative.
Trigonometric Functions
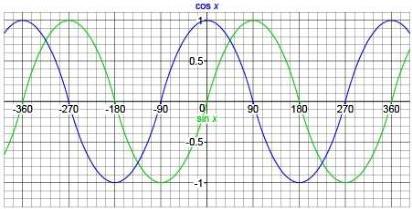
Trigonometric functions are periodic, meaning they repeat their shapes at regular intervals. When using degrees:
- and : Both vary between a maximum of and a minimum of . Key values include , , , and .
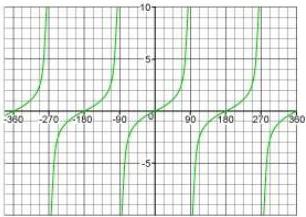
- : This function varies from to . It has a value of 0 at and approaches infinity as it nears .
Worked Example: Comparing and
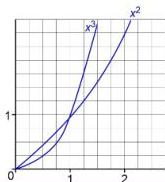
Problem: Sketch the graphs of and for the range .
Solution: Both graphs start at and pass through . For values of between 0 and 1, such as , we find that (since ). For values where , the cubic grows much faster, meaning .
Worked Example: Intersections
Problem: Determine how many points of intersection exist between and .
Solution: By sketching both curves on the same axes, we observe their behaviour. The reciprocal curve stays in the first quadrant for . The exponential growth curve also stays in the first quadrant. They cross at exactly one point.
Worked Example: Trigonometric Inequalities
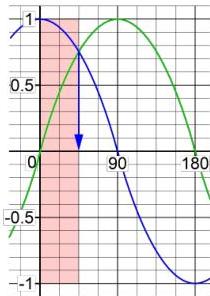
Problem: Find the range of values for which within the interval .
Solution: Sketch both and . At , and , so the condition is met. The graphs intersect when , which occurs at . Beyond this point, becomes larger than (which eventually becomes negative). Therefore, the range is .
Key takeaways
- Linear graphs are straight lines determined by , where is gradient and is the y-intercept.
- Quadratic graphs are parabolas with a line of symmetry: the sign of the term determines if it opens upwards or downwards.
- Exponential functions always pass through and never reach .
- The reciprocal function is asymptotic to both the x and y axes.
- Trigonometric functions are periodic: and oscillate between and .
When asked about intersections or inequalities, always start by sketching the functions. A visual representation often makes the number of solutions or the required range immediately obvious, preventing algebraic errors.
Be careful with reciprocal graphs: students often forget the third quadrant part of or incorrectly draw it touching the axes. Remember that the axes are asymptotes.
Notice the relationship between and : the cosine graph is effectively the sine graph shifted 90 degrees to the left. This explains why .
Worked Examples
Practice Questions
Frequently asked questions
What is the order of rotational symmetry for a cubic graph?
A simple cubic graph of the form has rotational symmetry of order 2 about the origin .
Why does always pass through ?
For any positive value of , . Since the y-intercept occurs where , the coordinate is always .
What happens to the graph of as gets very small?
As approaches zero from the positive side, increases towards positive infinity. As approaches zero from the negative side, decreases towards negative infinity.
How can I find the turning point of a quadratic graph without calculus?
You can find the turning point by completing the square to put the equation in the form . The turning point is then at .