Exponentials and their Graphs
Updated August 2025
Exponential functions of the form are fundamental in the TMUA for modelling growth and decay. This topic covers the distinct shapes of these graphs for bases greater than, equal to, or less than 1. Understanding the asymptotic behaviour toward the x-axis and the universal y-intercept at 1 is essential for exam success.
The function (where ) represents a relationship where the rate of change is proportional to the value itself. Its graph is a continuous curve that always passes through and never crosses the x-axis.
Introduction to the Exponential Graph
The exponential function is distinct because the variable appears as the exponent. This creates a specific family of curves. For the TMUA and ESAT, we focus on cases where the base is a simple positive value.
A crucial feature of all such graphs is that they intersect the y-axis at the point . This occurs because for any positive value of . Furthermore, because is positive, will always be positive regardless of the value of . This means the graph stays entirely above the x-axis, which acts as a horizontal asymptote.
The Three Cases for the Base
The shape of the graph depends entirely on the value of the base . We categorise these into three distinct cases.
Case 1: (Exponential Growth)
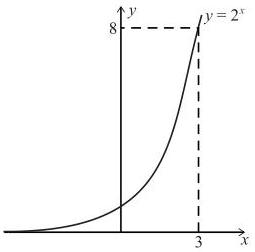
When the base is greater than 1, the function represents exponential growth. As increases, increases at an accelerating rate. As becomes more negative, the value of gets closer and closer to 0 but never reaches it. For example, if we consider , as moves from 1 to 2 to 3, moves from 2 to 4 to 8. Conversely, as moves to -1, -2, and -3, becomes , , and .
Case 2: (Exponential Decay)
When the base is between 0 and 1, the function represents exponential decay. This graph is effectively a reflection of a growth graph in the y-axis. For instance, is identical to . As increases, the value of gets smaller, approaching the x-axis as an asymptote. As becomes more negative, grows very large.
Case 3:
This is a trivial or boundary case. Since raised to any power is always 1, the equation simplifies to the horizontal line . It does not exhibit the characteristic growth or decay curve of other exponential functions.
Why must be positive?
The specification restricts our study to positive values of . This is because negative bases lead to complex mathematical issues. Consider : if , then , which is a real number. However, if , then is the square root of a negative number, which does not exist in the real number system.
If we attempted to graph , we would see a series of disconnected dots rather than a smooth, continuous curve. To maintain a functional, continuous curve that behaves predictably across all real values of , we require .
The Effect of Increasing the Base
You should understand how the graph changes as gets larger (assuming ). As increases:
- For positive values of , the graph becomes steeper, rising much faster toward infinity.
- For negative values of , the graph approaches the x-axis () more rapidly.
- The graph still passes through regardless of how large becomes.
By comparing and , you can observe that is 'higher' than for all , but 'lower' (closer to the axis) for all .
Key takeaways
- Every graph passes through the point because .
- The x-axis is a horizontal asymptote: approaches 0 as becomes very negative (for ) or very positive (for ).
- The function is strictly increasing if and strictly decreasing if .
- Negative bases are excluded because they produce undefined real values for many exponents, preventing a continuous curve.
In the TMUA, always check the base . If a question involves , treat it as a decay problem or rewrite it as to use your knowledge of .
A common mistake is thinking that can be negative if is negative. Remember that a negative exponent like means , which is (a positive number). The graph never goes below the x-axis.
Exponential functions grow faster than any polynomial function . Even if is only 1.001 and is 1,000, eventually will overtake . This property is a key reason why exponentials are used to model uncontrolled growth in biology and finance.
Worked Examples
Practice Questions
Frequently asked questions
Does the graph of ever touch the x-axis?
No. For any real value of and any positive base , is always strictly greater than zero. The x-axis is a limit that the graph approaches but never reaches.
What is the domain and range of an exponential function?
The domain is all real numbers . The range is . Notice that cannot be zero or negative.
How do I sketch if ?
Since , this is an exponential decay graph. It is the reflection of in the y-axis.
What happens if is very close to 1 but not equal to 1?
If is slightly larger than 1, the graph grows very slowly. If is slightly smaller than 1, it decays very slowly. The curve becomes flatter, looking more like the horizontal line .